A small package of form cues appeared to improve my running overnight. A fifty-three-run archive check would not be kind to my headline.
I uploaded another Garmin activity to an AI model expecting the usual advice about slowing down and recovering better. The analysis pointed somewhere else: at my running form. I was spending too much of every stride moving upward. The advice was insultingly simple. Shorter steps, quicker steps, land under the body, stop trying to fly between them.
The next day Garmin reported a vertical ratio of 10.1%, down from 11.3%. Minus 1.2 percentage points in twenty-four hours. My comeback runs had just become an experiment. Had the model found a real form problem, or something else?
The experiment now has a deadline: the Sofia Marathon, this October, 42.2 kilometres. On 10 June it had none. The entry was still eighteen days away.
From a 207 bpm 10K Finish to a Marathon Entry
Last October I finished the Sofia Marathon 10K in 1:00:20, in bad shape and with the numbers to prove it. Average heart rate 181, maximum 207, and most of the final minute above 195.
Then running left the centre of my life, first to a snowboarding winter and a finger surgery, then to the renovation that took my lower back when I decided that carrying 120×60 cm tiles alone was reasonable.
By the time I was running again in 2026 there was no marathon plan. My first AI message about running was meant for my brother: on the evening of 5 May I typed into what I thought was our chat that he could ask ChatGPT how to prepare to run at 5:00 per kilometre, and sent it to ChatGPT. My opening move in this project was informing ChatGPT of the existence of ChatGPT. It took the news well. That is when it clicked: I could ask for myself. A few messages later I pasted my Garmin numbers into GPT-5.5 and asked for a plan, and what came back was an eight-week plan for a 25-minute 5K. That was the whole ambition.
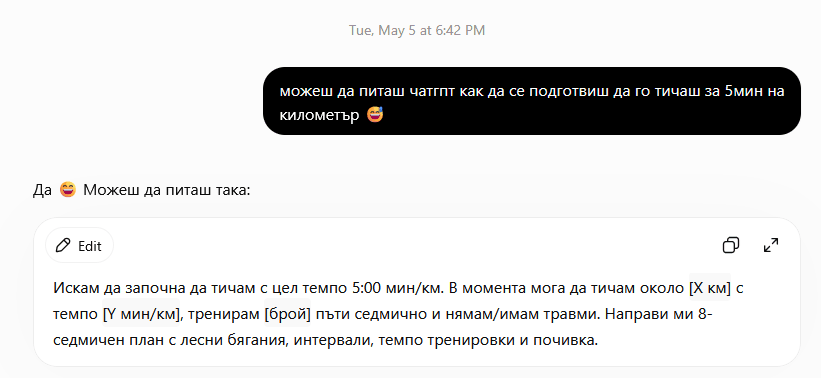
Translated from Bulgarian. The message meant for my brother: "you can ask chatgpt how to prepare to run it at 5 min per kilometre." ChatGPT: "Yes 😅 You can ask like this," then a template and the checklist.
On 28 June, after an 11K trail race, I entered the full Sofia Marathon. It is the same event where the 207 happened, one year on and four times the distance. This October I want to cross that finish line with a heart that stayed where I put it.
The Bug: Ignoring Garmin's Running Dynamics
Garmin was already recording more than pace and heart rate: cadence, stride length, vertical oscillation, ground contact time, vertical ratio. I treated those columns as decoration. The rig is a MARQ Gen 2 on the wrist and an HRM-Pro Plus chest strap, so heart rate and the running dynamics come from the chest, and the strap was on for both runs in this story and for forty-five of the fifty-three in the archive check.
Vertical ratio is vertical oscillation divided by stride length, the bounce of the torso against the distance each step travels, shown as a percentage. Lower oscillation has been associated with better running economy in group studies, but the ratio itself is not a measure of economy. It is a ratio of two distances, nothing more. The comparison that matters is me against my own numbers once pace is accounted for.
On 10 June I ran 5.42 km at 7:11/km, average heart rate 152, vertical ratio 11.3%. Nothing catastrophic. The run just looked expensive for the speed it bought.
The Patch: Stop Bouncing
What the model saw: one 5.42 km activity with pace, heart rate and the running dynamics attached. No earlier runs, no baseline, no video.
The cues were not a running-form rebuild, which would have been a terrible idea a few weeks into a comeback. They were five small, general cues, the kind any coach could have handed me: shorter and quicker steps, less reaching forward, nothing exotic. Except no coach was in the room, and no coach had just read my Garmin file. I did not save the exchange, so even that summary is from memory. Five cues at once is a package, with no single clean variable in it.
The Diff: Garmin Before and After
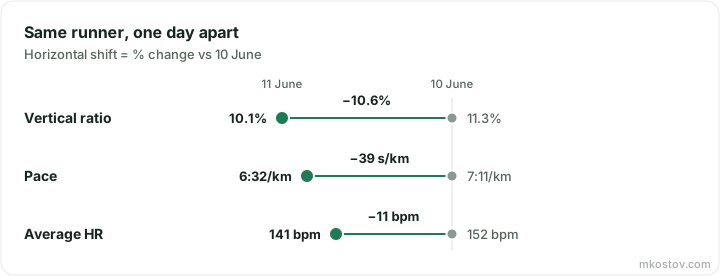
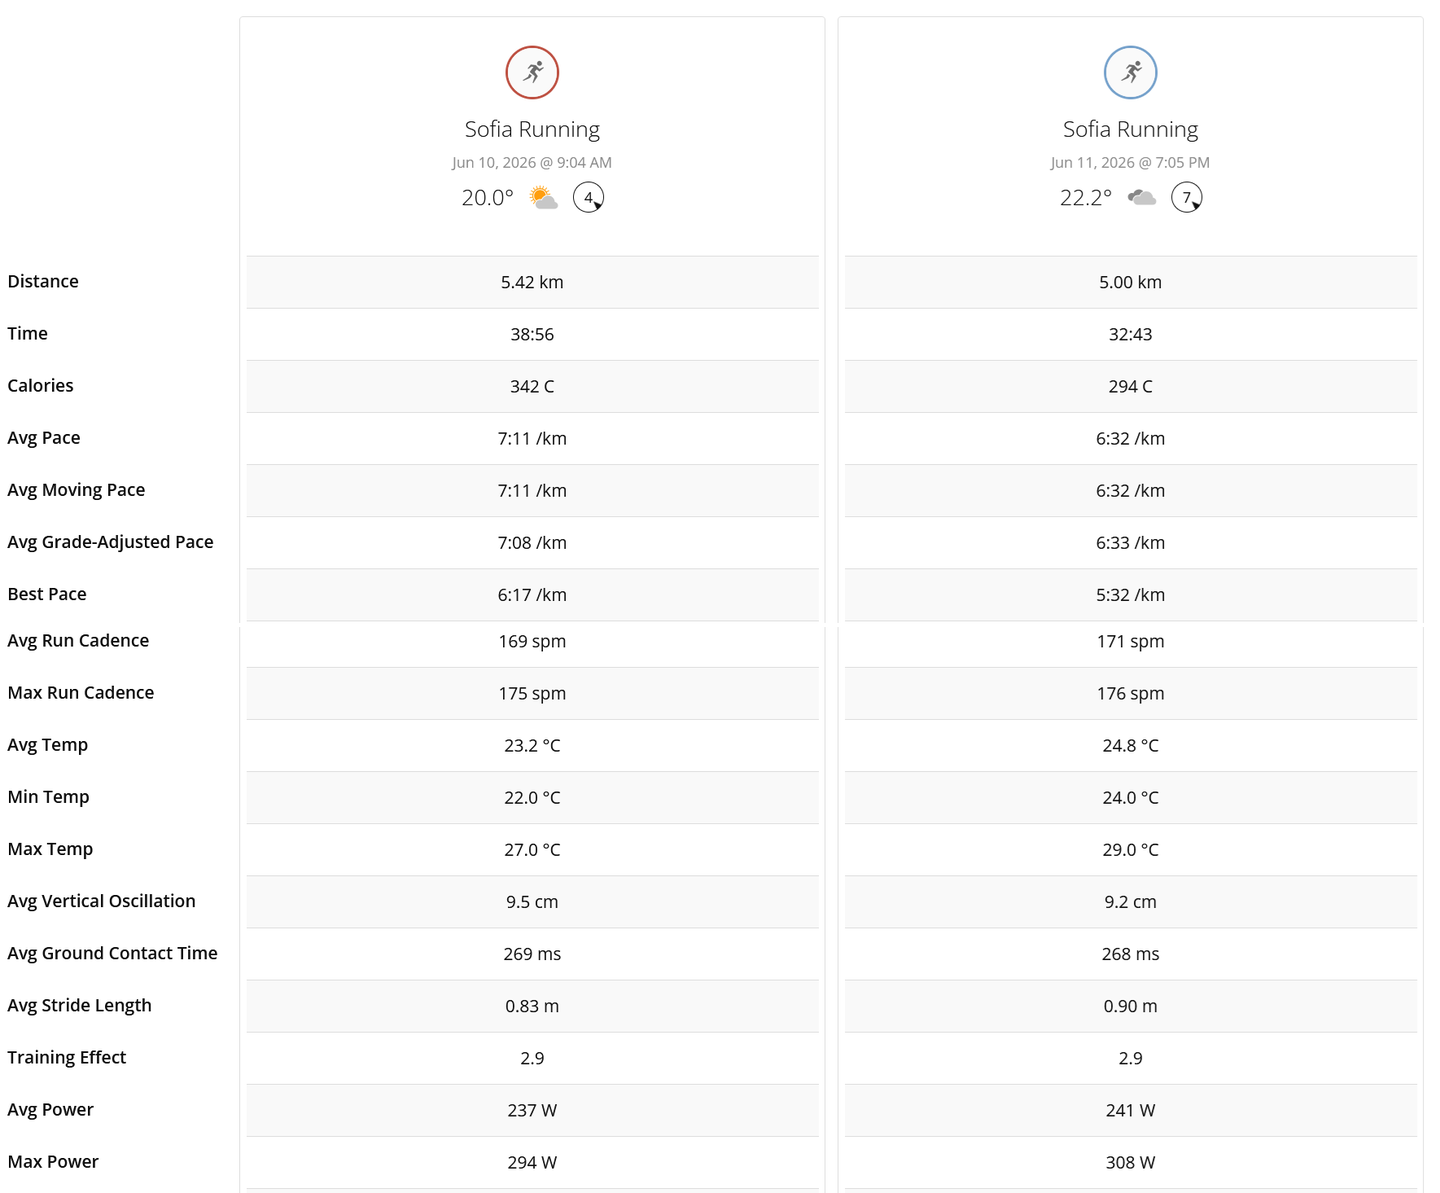
Session averages from Garmin's activity export. Both runs felt easy, about 5 km. Garmin Connect's own side-by-side agrees, and grade-adjusted pace sits within seconds of raw pace on both days, so elevation was probably not the main explanation.
The decomposition matters more than the headline drop: a little less bounce, more distance per step. The stride did most of the work.
Shorter steps producing a longer stride looks like a contradiction. My reading at the time was reaching less in front of the body, but nothing in the file measures that. The reading the file does support is less flattering: stride length is the denominator of the ratio, it grows with speed, and the second run was faster.
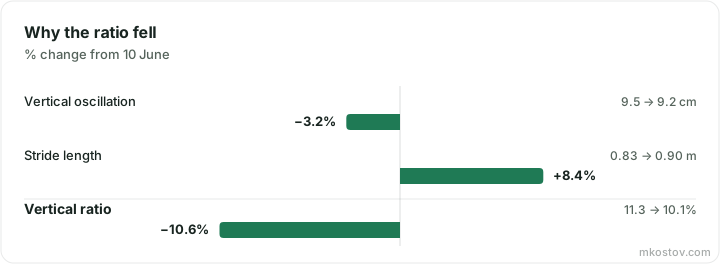
Vertical ratio = vertical oscillation ÷ stride length, so both changes push it the same way. Garmin's session averages are rounded, so the components do not recompute the ratio exactly.
Cadence rose two steps per minute. Together with the longer stride, that accounts arithmetically for the faster pace. Ground contact time was effectively unchanged.
These were not controlled runs. The second was 39 seconds per kilometre faster under different conditions, and one pair cannot isolate the effect of the cues. The sentence I am not allowed to write: AI made me 10% more efficient overnight. The sentence the data supports: a 10.6% lower vertical ratio on the next run, with a lower heart rate at a faster pace. Whether it persisted is the question the archive answers.
The Archive Check: How the Before and After Nearly Fooled Me
Two months later, while editing this piece, I ran the check a good reviewer would demand: every run in my archive, vertical ratio against pace, before the cue and after.
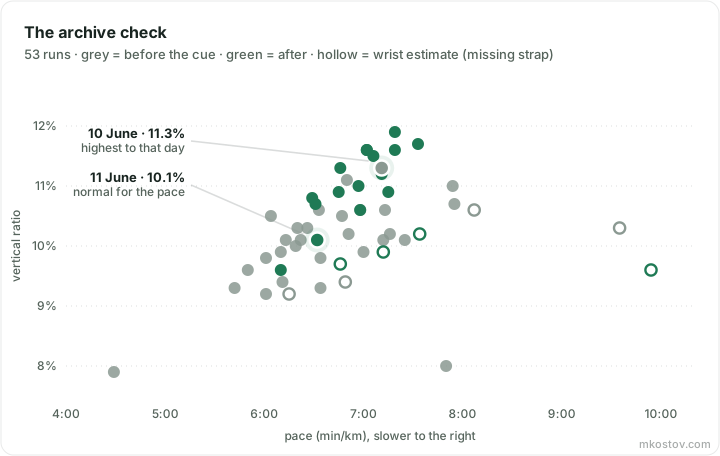
Every comparable run in the archive. Hollow points are wrist estimates, no chest strap. The two June runs are marked.
The archive was not kind. The 11.3% of 10 June is my highest ratio up to that day, an outlier and not my baseline. The 10.1% of 11 June is normal for me at that pace, and I had touched 9.4% in May before the cue existed. At easy paces since, on long runs and tired legs, the ratio has drifted back above 11.
Fit a line through ratio against pace for the forty-five strap runs, twenty-nine before the cue and sixteen after, and the after runs sit about 0.8 percentage points higher. The periods differ in distance, fatigue and season, so I read that as a failure to find a breakthrough rather than proof the cue made me worse.
So the honest verdict: one bad day, then a faster evening run, dressed up as progress and consistent with regression to the mean. The cue about not reaching forward may still be good advice. The numbers do not prove it worked, and catching that is the entire reason this series logs everything.
The model deserves its share of the verdict. I gave it one run and no baseline, and it read the outlier as my form. The outlier fooled us both, so the next diagnosis starts from the whole archive. The loop stays manual for now. The watch and the strap record, and the file goes to the model with the context Garmin cannot know: the furniture I carried the day before, the bad sleep, the sore skin between two toes. A patch is kept only when the whole history at similar paces agrees. Hand a model one isolated day of your data and it may turn an outlier into a confident story.
The model told me to stop bouncing. The archive says the bounce was mostly one bad morning. Every patch from here answers to October, and to the runner who actually shows up on Tuesday.
The model can suggest. The legs have veto power.
Appendix
Archive-check method: I included only runs recorded with the chest strap, 29 before the cue and 16 after. I fitted an ordinary least-squares linear regression of vertical ratio against pace. This was a descriptive sensitivity check, not a causal analysis. It did not adjust for distance, terrain, temperature, fatigue, or workout type.
Further reading: Garmin's definition of vertical ratio and a 2024 systematic review and meta-analysis of the relationship between running biomechanics and running economy.